· Atanas Desev · Sitecore
What Vercel Microfrontends Actually Cost
We audited a four-app Sitecore XM Cloud platform and found 81.8% of the Vercel bill had nothing to do with traffic. Here is how the metering works and what to do about it.
In part 1 we covered what breaks when you put Vercel Microfrontends in front of a Sitecore XM Cloud build - the asset-prefix bug, the dead soft navigation on the shell, the redirect loops.
This post is about the invoice.
The trigger was a ticket that said, in full: "please investigate the high vercel cost - report can be pulled from vercel." What we found was not a traffic problem, a caching problem, or a code problem. It was an architecture decision nobody had priced.
The headline
One billing cycle on Vercel Enterprise, measured 20 days into a 31-day cycle:
Monthly commitment | 1,000 MIU |
Consumed | 2,858 MIU (286%) |
On-demand overage | 1,857 MIU |
MIU is Vercel's Managed Infrastructure Unit - the abstract unit Enterprise plans meter against, so that edge requests, function time, transfer and everything else land on one number.
Now the breakdown that matters:
Product | Volume | MIU | Share |
|---|---|---|---|
Microfrontends Projects (licence) | 12 projects | 2,339 | 81.8% |
Fluid Provisioned Memory | 10.19K GB-Hrs | 110 | 3.8% |
Fast Data Transfer | 596.51 GB | 91 | 3.2% |
Fluid Active CPU | 594 hours | 80 | 2.8% |
Edge Requests | 28.9M | 68 | 2.4% |
Microfrontends Routing | 25.7M | 51 | 1.8% |
ISR Writes | 10.8M | 43 | 1.5% |
Fast Origin Transfer | 542.04 GB | 39 | 1.4% |
Function Invocations | 21.2M | 13 | 0.4% |
Edge Requests – Additional CPU Duration | 33 hours | 12 | 0.4% |
ISR Reads | 14.2M | 6 | 0.2% |
Image Optimization | 15.1K transforms | 1 | 0.0% |
Build CPU Minutes | 42 hours | 0 | 0.0% |
Total (invoiced) | 2,858 |
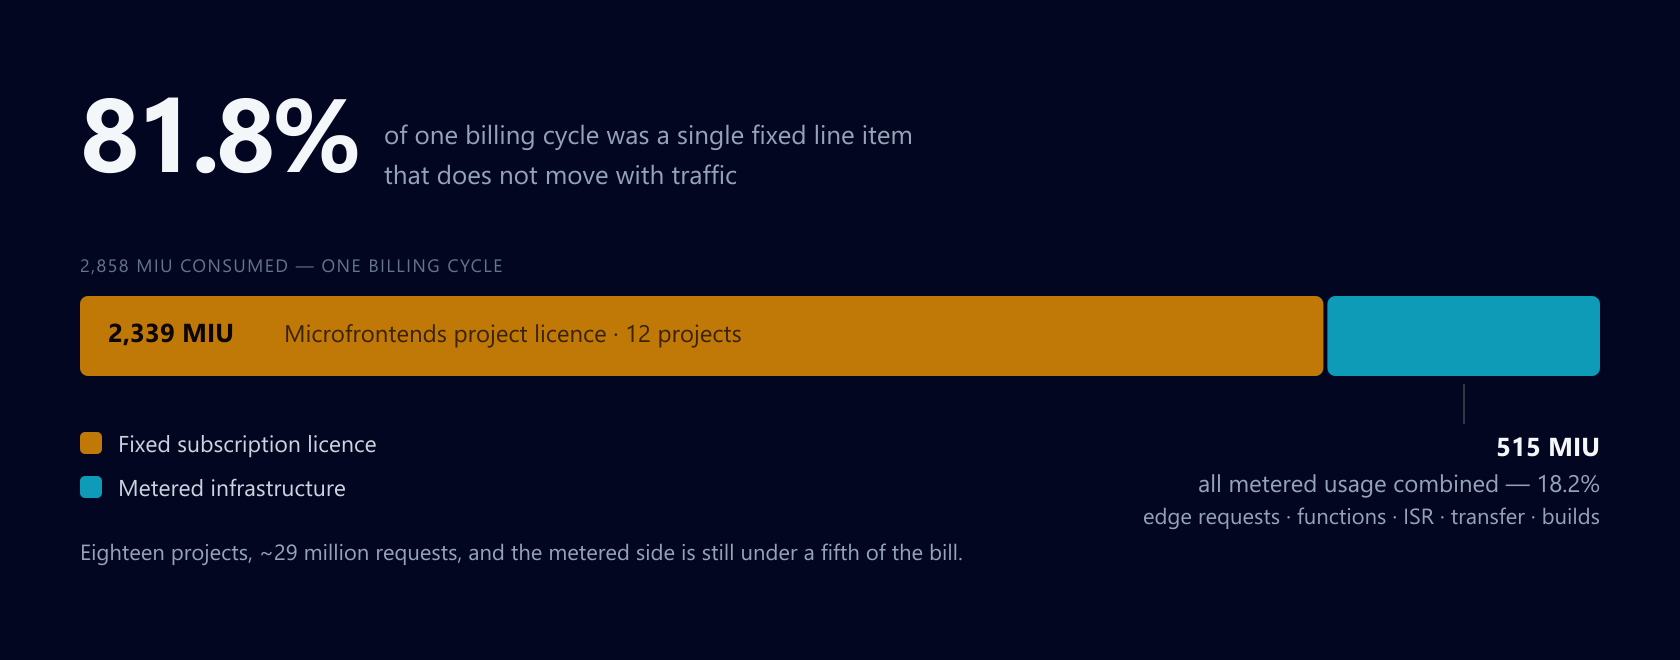
81.8% of the cycle was the fixed microfrontends licence (2,339 MIU); all metered usage combined was 18.2% (519 MIU). Shares are against the invoiced 2,858 MIU. The line items as Vercel reports them are individually rounded and sum to 2,853, so they fall 5 MIU short of the invoice total.
Everything metered - every edge request, every function invocation, every byte transferred, across twelve projects and roughly 29 million requests - comes to 519 MIU. 18.2%.
The other 81.8% is a subscription licence charged per project in a microfrontends group. It does not move with traffic. It is the same number on a quiet August as on Black Friday.
Where the twelve projects came from
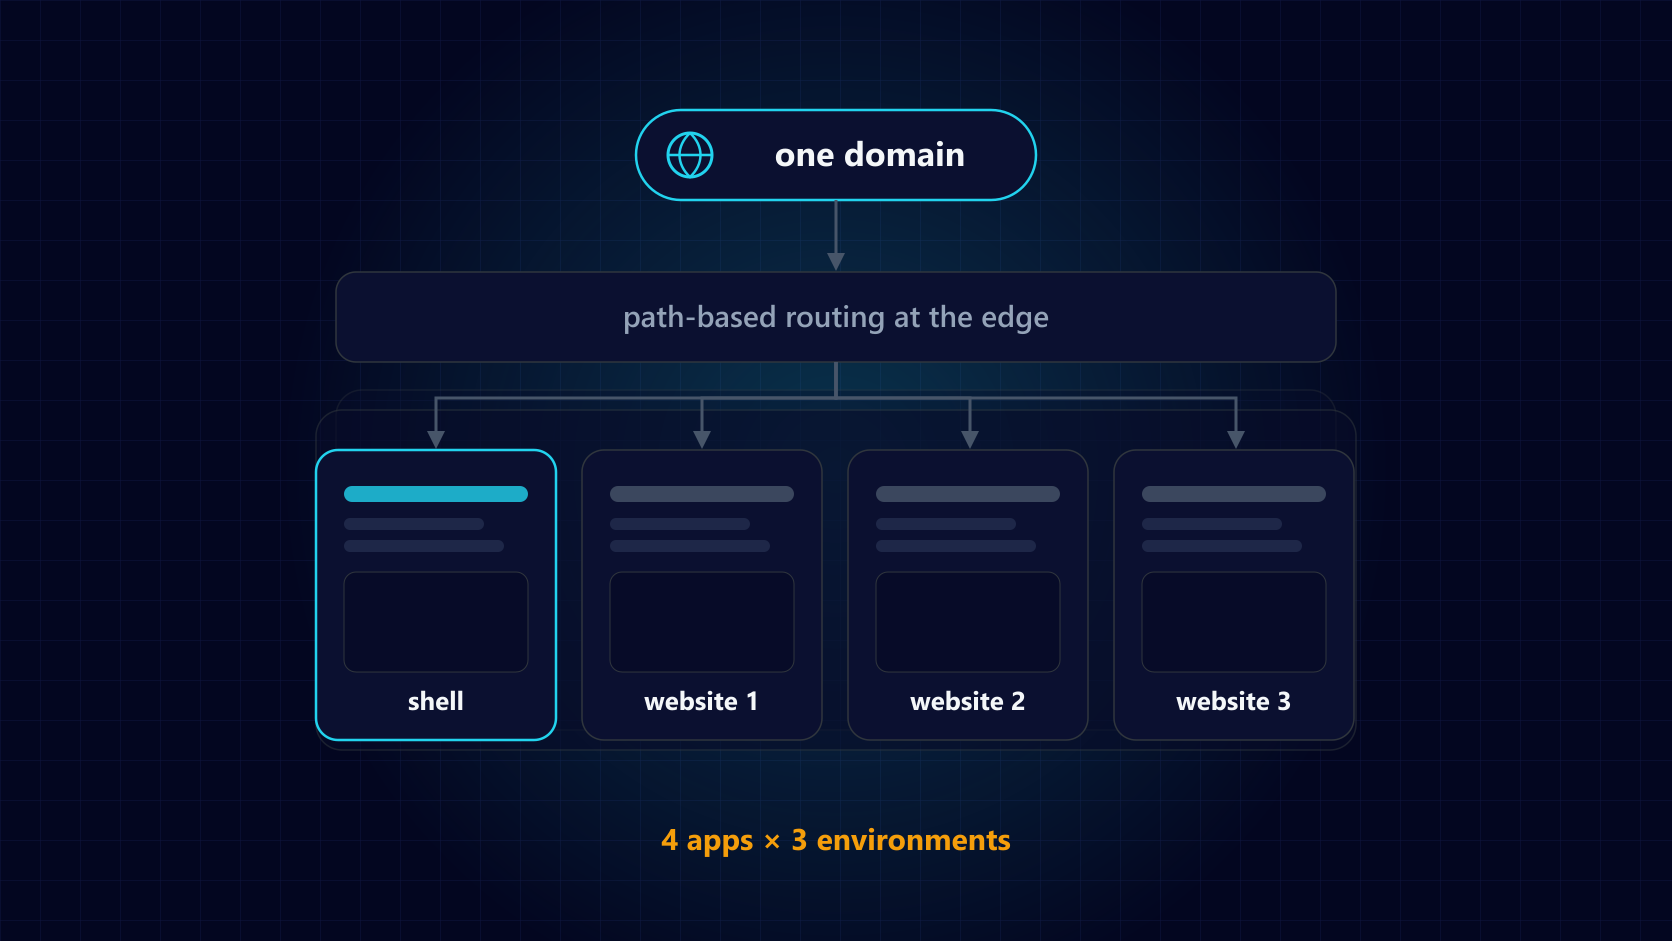
Part 1 described the architecture: four Next.js applications - shell, website 1, website 2, website 3 - in a Vercel Microfrontends group.
What it did not dwell on is that we run that group three times: dev, staging and prod. Four projects each. Twelve projects, twelve licences.
Group | Projects | Approx. licence cost | Metered usage |
|---|---|---|---|
prod | 4 | ~780 MIU | 411 MIU |
staging | 4 | ~780 MIU | 53 MIU |
dev | 4 | ~780 MIU | 49 MIU |
At roughly 195 MIU per project per cycle, the dev and staging groups cost about 1,559 MIU a month - 55% of the entire bill - to serve 102 MIU of actual traffic.
That is the whole finding. Nobody made a bad decision; the environments were mirrored for good engineering reasons, and each one was a reasonable choice in isolation. The cost simply never surfaced, because the licence is invisible until you look at the Subscription Licenses row on the usage page - which is below the fold, under a heading most people scroll past.
What we did about it
Dissolving the dev and staging groups does not mean deleting the environments. The child apps keep their own domains and deploy exactly as before; they just stop being members of a group. You lose path-based routing across them in non-production - which matters if you QA cross-zone navigation, and does not if you QA each app on its own host.
Combined with folding Website 2 (4 MIU of traffic, a full licence) back into the shell, that takes the cycle from 2,858 MIU to roughly 1,100 - at or near the commitment, with no application code change at all.
The lesson that generalises
Price the group before you build it. The question is not "do we want independent deploys" but "do we want independent deploys in every environment, at a fixed monthly cost per app per environment".
Our answer, in hindsight: production yes, staging maybe, dev no.
And if your contract is resold - ours is, through Sitecore - the rate card is not in the Vercel dashboard at all. Get the per-project figure from your account team before you design the topology, not after the first overage.
Microfrontends routing is its own meter
Worth stating plainly, because it surprised us: the routing decision is billed separately from the request.
Edge Requests: 28.9M → 68 MIU
Microfrontends Routing: 25.7M → 51 MIU
Nearly every request that reaches the group is metered twice - once as an edge request, once as a routing operation. Routing added about 75% on top of the edge-request line.
This does not make microfrontends expensive on its own; at these volumes it is under 2% of the bill. But it does mean that anything which reduces junk requests pays off twice, which changes the return on the work in the next three sections.
Where the other 18% goes
With the licence set aside, the metered usage has a clear shape. Four things dominate, and three of them are self-inflicted.
1. ISR write amplification across 21 locales
On the busiest production app over 12 hours: 68K ISR read units against 58K write units. A ratio of 0.85.
That ratio should be nowhere near 1. ISR exists so that one render serves many reads. Writes cost ten times what reads do in MIU terms (4.00 vs 0.40 MIU per million on the published rate card), so a 0.85 ratio means you are paying render prices for cache behaviour.
Two causes.
A 15-minute TTL across an enormous path surface. Our cache configuration is centralised, which is good practice:
xm-cloud-app/src/lib/cache-config.ts
const DEFAULT_TTL_SECONDS: Record<TtlDomain, number> = {
  page: 900,          // 15 min
  product: 3600,
  menu: 3600,
  dictionary: 3600,
  sitemap: 3600,
  robots: 3600,
  searchResults: 60,
  downloadProxy: 0,
  job: 1800,
};
15 minutes is fine for one site. Multiply by 21 locales times several thousand paths and every path revalidates about 96 times a day whether or not an editor touched anything. We measured 26K time-based revalidations in 12 hours on one app.
The fix costs nothing, because every TTL is already environment-driven:
const ENV_VAR_BY_DOMAIN: Record<TtlDomain, string> = {
  page: 'PAGE_REVALIDATE_SECONDS',
  product: 'PRODUCT_REVALIDATE_SECONDS',
  // …
};
Set PAGE_REVALIDATE_SECONDS=3600 in the Vercel project. These are server-only variables, so they apply on redeploy without a rebuild. We expect ISR writes to fall by roughly three-quarters.
The precondition is that on-demand revalidation actually works - the Sitecore publish webhook hitting /api/revalidate. Check the logs before you raise the TTL, not after. A long TTL with a broken webhook is a content-freshness incident.
Tag revalidations: zero. We use per-path res.revalidate(), which means a publish invalidates only what we can enumerate, and the short TTL is doing the rest as insurance. Moving to cache tags lets a publish invalidate precisely by Sitecore item, which in turn lets the TTL go to six hours or more. That is the structural fix; the env var is the quick one.
2. A synthetic locale nobody meant to serve
This one is specific to Next.js i18n, and worth checking in your own build.
Our config declares a synthetic default locale:
i18n: {
  // 'default' is a synthetic locale that prevents Next.js from stripping /en/ from URLs.
  locales: ['default', ...SUPPORTED_LOCALES],
  defaultLocale: 'default',
  localeDetection: false,
},
Middleware is supposed to redirect /default/* to a real locale. In production, the observability data said otherwise:
Route (12 hours) | Edge requests | Cached | ISR reads | ISR writes | Unique paths |
|---|---|---|---|---|---|
| 16K | 75.7% | 6.3K | 6.5K | 3.3K |
| 75K | 99.3% | 4.6K | 2.0K | 654 |
| 12K | 96% | 4.7K | 1.8K | 1.0K |
Read that middle column again. The default locale writes more ISR entries than it reads, and it has generated 3,300 unique paths - five times more than /en, our largest real locale.
What is happening: crawlers and legacy inbound links hit non-localised URLs, those fall into the default catch-all, and each one mints a cache entry that is written once and essentially never read again. It is a machine for converting bot traffic into ISR writes.
The fix is to redirect /default* in middleware before anything renders, return notFound from getStaticProps for locale === 'default', and add Disallow: /default to robots.txt. Roughly 11% of our ISR writes, gone.
Generalisable check: open ISR observability, sort routes by write count, and look for any route where writes approach reads. That is always a bug, and usually a routing one.
3. Bot traffic, unmanaged
Firewall on the main production app, one day: 820.5K requests allowed, 19.0K denied, 6.4K challenged. Bot Protection: inactive.
The top ten bots over 12 hours, against 422K total edge requests:
Bot | Requests /12h | Cached |
|---|---|---|
uptime-robot | 23K | 99.9% |
facebookexternalhit | 10K | 97.7% |
googlebot | 8.7K | 91.4% |
shapbot | 5.1K | 93.5% |
chrome-lighthouse | 4.5K | 97.4% |
google-adsbot | 3K | 87.9% |
bingbot | 2.7K | 52.2% |
applebot | 2K | 56.2% |
seranking-backlinks | 1.9K | 84.2% |
meta-externalads | 1.7K | 98.1% |
The top ten alone are about 15% of all traffic on the busiest app, and the list runs to five pages.
Look at the first row. uptime-robot: 23,000 requests in 12 hours - one every 1.9 seconds, roughly 1.4 million a month. That is not monitoring, that is a monitor pointed at too many URLs at too short an interval. Nobody configured it maliciously; it accumulated one check at a time.
Two things worth knowing:
Firewall-mitigated requests are not billed. Since May 2026 Vercel waives CDN (edge) requests and Fast Data Transfer for traffic the WAF denies, challenges or rate-limits - not only denies. A request that passes a challenge and continues to the app is billed normally. A deny rule is genuinely cheaper than caching harder, which inverts the usual instinct.
Look at the cached column, not just the count.
bingbotandapplebotsit at 52% and 56%. A bot with a low cache-hit rate is crawling deep into the long tail, and every miss is a function invocation and an ISR write. A high-volume bot at 99% cached costs far less than a low-volume one at 50%.
Do not block Googlebot, Bingbot or Applebot. Do enable managed bot rules in log mode first, review for 48 hours, then challenge or deny the SEO-tool scrapers and AI crawlers. And go fix your uptime monitor.
Price the protection, too. Mitigated traffic is free; inspecting it is not. On the Enterprise rate card, OWASP managed-ruleset inspection bills 0.80 MIU per million requests inspected, and rate limiting 0.50 MIU per million requests allowed. At the main app's volume - about 846K requests a day, roughly 26M over a 31-day cycle - running OWASP rules on everything would add about 21 MIU a cycle, and a rate-limit rule across all allowed traffic about 13 MIU. Small against a 2,858 MIU bill, but not zero, and more than several line items in the breakdown above. Scope both to the paths that need them - forms, search, API routes - rather than the whole site.
4. Middleware, and what a migration does to it
Our edge middleware is 2,062 lines. It ran 423K times against 651K edge requests in 12 hours - 65% of all traffic - costing 33 hours of additional edge CPU.
Some of that is unavoidable: locale resolution, site resolution, personalisation, the microfrontend host logic from part 1. Much of it is migration debt:
447 inline redirects in
vercel.jsona 122 KB
legacy-map-a.jsonredirect map imported directly into the edge bundlea 48 KB bulk-redirects file
proxy logic for six legacy Drupal asset trees
That last one has a cost we did not anticipate. Checking external origins showed 2.7K rewrites to the legacy host in 12 hours, predominantly 4XX. One endpoint stood out: an old Drupal statistics beacon, still firing from legacy pages, at 5.7K requests per 12 hours, 0% cached - and every one of those is an edge request plus a middleware invocation plus origin transfer, to fetch a 404.
The fixes, in order of effort:
Return 410 at the edge for legacy paths that only ever 404. Cheap, immediate.
Move static redirect maps out of the middleware bundle into Edge Config or platform redirects, so they resolve before middleware executes.
Narrow the matcher. Ours is deliberately broad to protect a staging password gate - which means production traffic pays for a staging feature. Note that part 1 warned against narrowing it carelessly while the legacy proxy is live; sequence these two changes together.
A fifth thing, unrelated to microfrontends but worth 15% of transfer
While in the data we found this, which will apply to most Next.js sites:
Asset (12 hours) | Requests | Transfer | Per request |
|---|---|---|---|
| 7.9K | 308.82 MB | ~39 KB |
| 7.9K | 300.14 MB | ~38 KB |
| 4.8K | 283.16 MB | ~59 KB |
| 4.9K | 194.54 MB | ~40 KB |
Per-request transfer equals full file size. These are complete re-downloads, not 304 revalidations - about 1.09 GB in 12 hours, 15% of all egress, for four font files totalling 236 KB.
The cause: Next.js applies long-lived immutable cache headers to /_next/static only. Files in /public are served with Cache-Control: public, max-age=0, must-revalidate unless you say otherwise, and nothing in our next.config.ts said otherwise.
xm-cloud-app/next.config.ts
async headers() {
  return [
    // …existing CORS and editing headers
    {
      source: '/assets/:path*',
      headers: [
        { key: 'Cache-Control', value: 'public, max-age=31536000, immutable' },
      ],
    },
  ];
}
One caveat: files in /public are not content-hashed, so pair immutable with a versioned filename (brandsans-bold.v2.woff2) or you cannot ship a font change for a year.
While you are there: one of those four is still a legacy .woff at 81 KB where the others are ~52 KB .woff2. No browser in a Next 15 baseline needs it.
If you take one thing from this section: open Fast Data Transfer in observability, sort by total transfer, and check whether the per-request figure equals the file size. If it does, your cache headers are not doing their job.
How to read your own usage page
Concretely, in the order we would do it again:
Usage → group by product. Find your equivalent of the licence line. Anything under Subscription Licenses is fixed cost - separate it from metered usage before you analyse anything, or the percentages will mislead you.
Usage → group by project. Sum the non-production projects. If that number is a meaningful share, you are paying production prices for test environments.
Observability → ISR. Compare read units to write units. Anything above about 0.3 needs explaining. Sort routes by writes.
Observability → Edge Requests → Bot Name. Note both volume and cache rate. Low cache rate is worse than high volume.
Observability → Fast Data Transfer. Per-request transfer versus file size, as above.
Observability → External Origins. If you proxy a legacy platform, check the status mix. Ours was mostly 4XX.
Firewall. Is Bot Protection on? What does the allowed/denied ratio look like?
Settings → Billing. Which CDN pricing model are you on? We were still on Legacy On Demand at nearly 29M requests a month, having never revisited it.
One practical note: without Observability Plus you get short retention and no custom queries. We did the whole audit on 12-hour windows, which was enough to find everything here, but it made the work slower than it needed to be. If you are going to do this more than once, price the add-on against the engineering time.
What we would do differently
Price the topology first. Four apps times three environments is a number you can multiply before you build it.
Do not mirror production structure into every environment by reflex. Dev did not need a microfrontends group. It needed four apps that deploy.
Set an alert at 60% of commitment. The overage was two weeks old before anyone looked. There is no reason for that to be true twice.
Treat ISR write/read ratio as a health metric, alongside cache hit rate. It is a better early-warning signal for routing bugs than anything in the error logs - the /default locale problem showed up there weeks before anyone would have found it any other way.
Put a cost line in the PR checklist for anything touching middleware, ISR TTLs, microfrontend membership or /public. Every finding in this post entered the codebase through a PR that was correct on its own terms.
Final thoughts
Microfrontends are not expensive. The per-project licence on a production group is a reasonable price for genuinely independent deploys, and the routing meter is a rounding error at our volumes.
What is expensive is buying that autonomy three times over for environments where nobody is deploying independently, and then not noticing because the fixed cost sits in a part of the dashboard that does not move.
The metered side is the more interesting engineering problem - and every item on it, without exception, was a correct-looking decision whose cost only appeared at scale. A 15-minute TTL is sensible. A synthetic default locale is a legitimate Next.js i18n pattern. A broad middleware matcher is the safe choice while you are migrating. Multiply each by 21 locales and 29 million requests and they become line items.
None of this is visible in a code review. It is visible on the usage page, which is why the useful habit is not "write cheaper code" - it is open the usage page once a month and ask what changed.